The beautiful complexity of the US radio spectrum
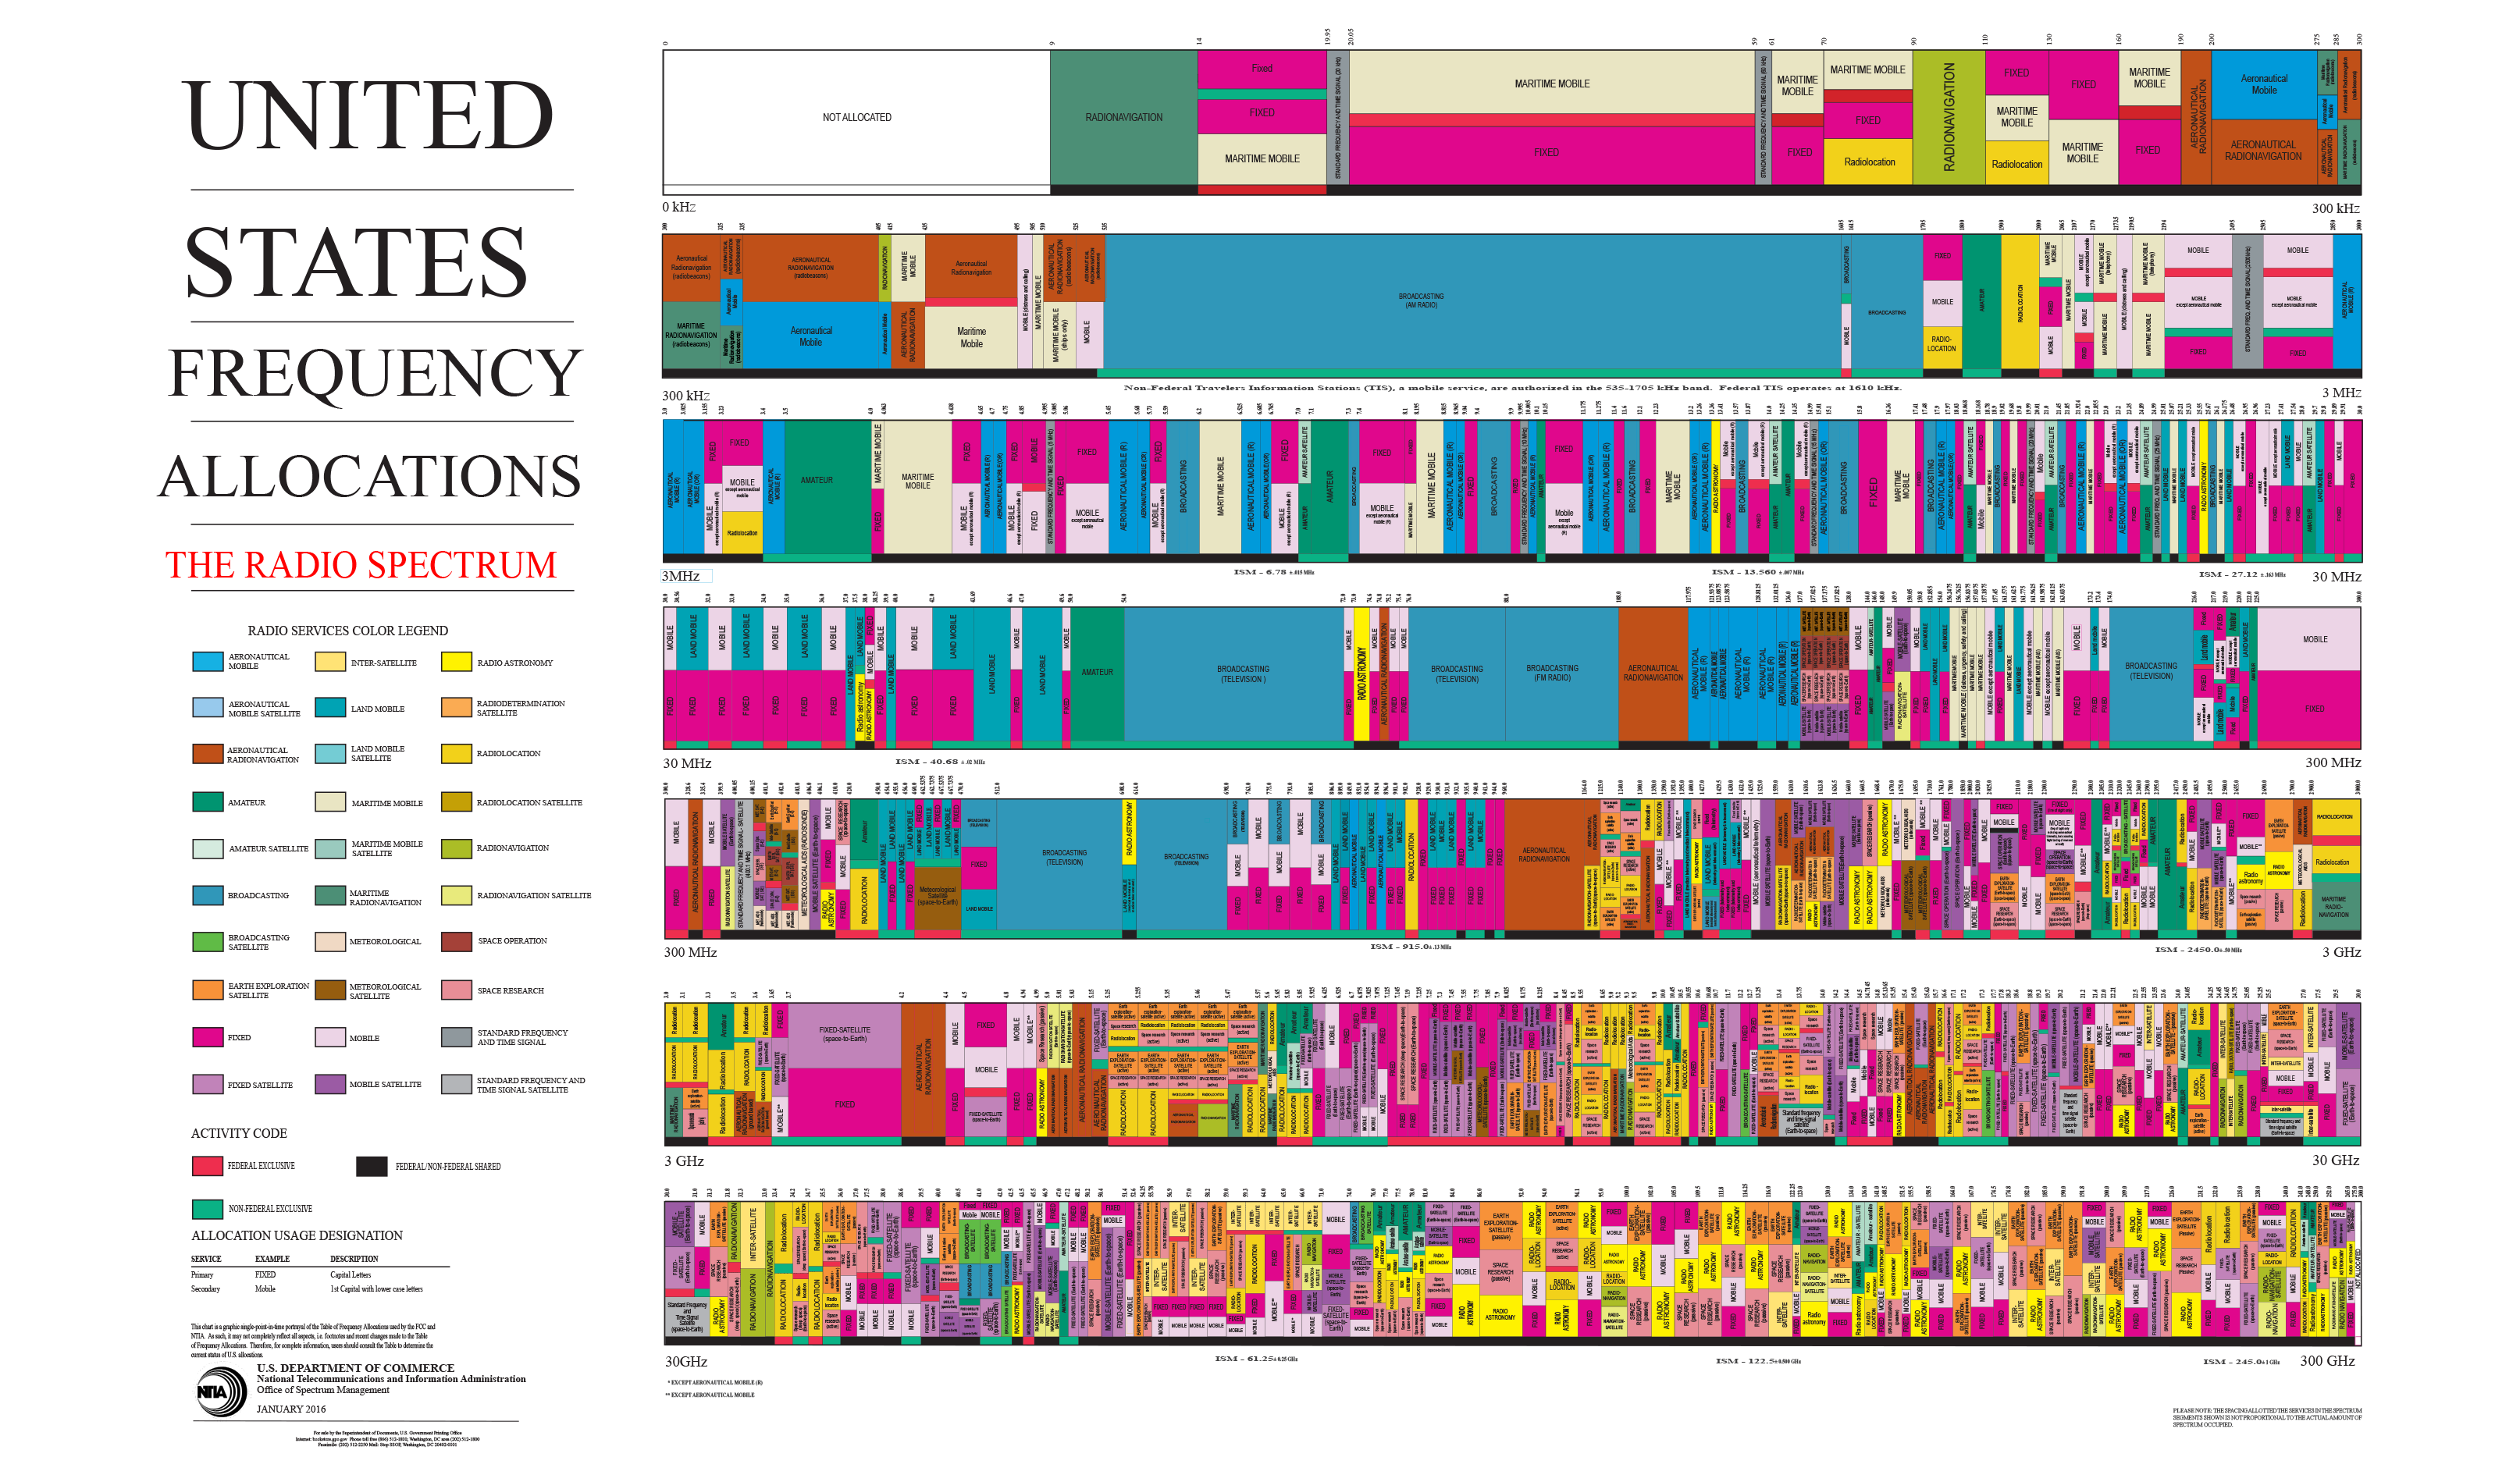
The United States Frequency Allocation Chart shows how the nation’s precious radio frequencies are carefully shared.

Somewhere above you right now, a plane is broadcasting its coordinates on 1090 megahertz. A satellite high above Earth is transmitting weather maps on 1694.1 MHz. On top of all that, every single phone and Wi-Fi router near you blasts internet traffic through the air over radio waves. A carefully regulated radio spectrum is what makes it possible for these signals to get to the right place intact.
The Federal Communication Commis-sion and the National Telecommunications and Information Administration share the task of managing radio frequencies for US airwaves. The NTIA manages all federal radio uses (including military use), while the FCC manages everything else. It is an incredibly complex system, and to help with the job of explaining the importance of managing this invisible natural resource, the NTIA publishes the United States Frequency Allocation Chart (which you can order as a wall chart for $6).

The US government lays claim to a large chunk of spectrum for military use, communications, and transportation. FM radio operates between 88 and 108.0 MHz, and AM radio operates between 540 and 1700 kilohertz. Using licenses, amateur radio operators are granted slices where they can communicate safely, as are businesses and other institutions. Civil aviation, maritime navigation, satellite communications, radio astronomy, cellular voice, and data all lay claim to colorful plots on this chart.
The chart uses 33 color-coded categories to visualize the information in a crazy quilt of blocks (some wide, some narrow), spread from 9 kHz (very low frequency) all the way to 300 GHz (extremely high frequency). It does suffer from scale distortions, not unlike a map of Earth.
Eric Rosenberg, a telecommunications specialist at NTIA, says a lot of the choices about what service goes where come down to physics and the environment where the service will be used: “You can’t just pick up a block and say, okay, we’re gonna move these radars over here.”
The chart is always extremely popular, Rosenberg says; fans include lawmakers in Congress. Last updated in 2016, it is due for another revision. “We’re getting to the point where we really feel that we need to redo it,” he says. “Again, it’s a very large project.” ν
A version of this story appeared on Beautiful Public Data (beautifulpublicdata.com), a newsletter by Jon Keegan (KE3GAN).
Deep Dive
Computing
Inside the hunt for new physics at the world’s largest particle collider
The Large Hadron Collider hasn’t seen any new particles since the discovery of the Higgs boson in 2012. Here’s what researchers are trying to do about it.
How ASML took over the chipmaking chessboard
MIT Technology Review sat down with outgoing CTO Martin van den Brink to talk about the company’s rise to dominance and the life and death of Moore’s Law.
How Wi-Fi sensing became usable tech
After a decade of obscurity, the technology is being used to track people’s movements.
Algorithms are everywhere
Three new books warn against turning into the person the algorithm thinks you are.
Stay connected
Get the latest updates from
MIT Technology Review
Discover special offers, top stories, upcoming events, and more.